Customer Reporting
This topic describes the customer and instance data displayed in the Customers > Reporting page of the Replicated Vendor Portal.
About the Customer Reporting Page
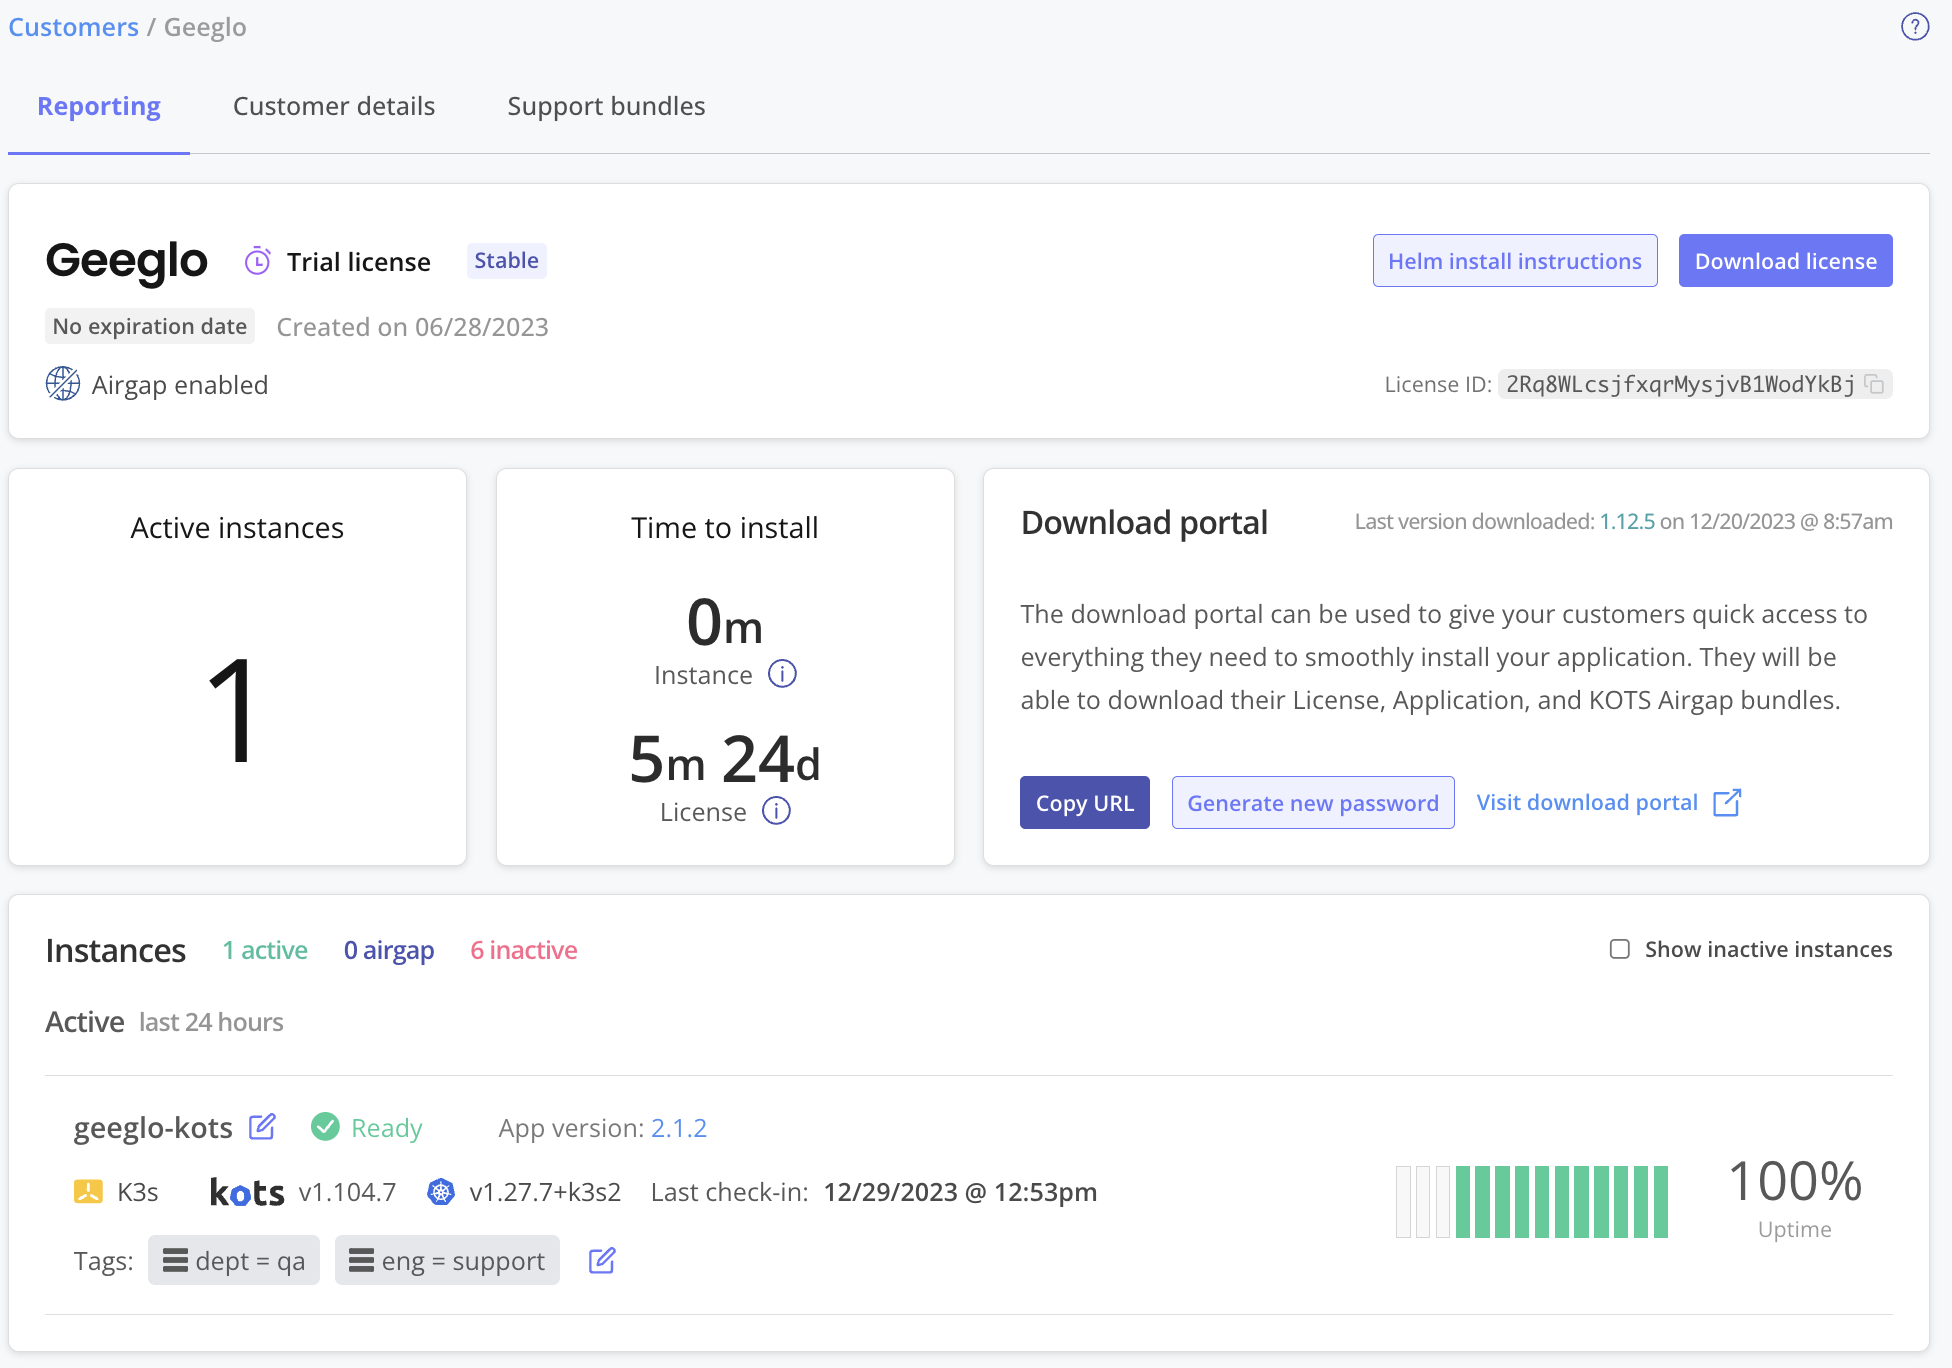
The Customers > Reporting page displays data about the active application instances associated with each customer. The following shows an example of the Reporting page for a customer that has two active application instances:

View a larger version of this image
As shown in the image above, the Reporting page has the following main sections:
Manage Customer
The manage customer section displays the following information about the customer:
- The customer name
- The channel the customer is assigned
- Details about the customer license:
- The license type
- The date the license was created
- The expiration date of the license
- The features the customer has enabled, including:
- GitOps
- Air gap
- Identity
- Snapshots
In this section, you can also view the Helm CLI installation instructions for the customer and download the customer license.
Time to Install
If the customer has one or more application instances that have reached a Ready status at least one time, then the Time to install section displays License time to install and Instance time to install metrics:
- License time to install: The time between when you create the customer license in the Vendor Portal, and when the application instance reaches a Ready status in the customer environment.
- Instance time to install: The time between when the Vendor Portal records the first event for the application instance in the customer environment, and when the instance reaches a Ready status.
A Ready status indicates that all Kubernetes resources for the application are Ready. For example, a Deployment resource is considered Ready when the number of Ready replicas equals the total desired number of replicas. For more information, see Enabling and Understanding Application Status.
If the customer has no application instances that have ever reported a Ready status, or if you have not configured your application to deliver status data to the Vendor Portal, then the Time to install section displays a No Ready Instances message.
If the customer has more than one application instance that has previously reported a Ready status, then the Time to install section displays metrics for the instance that most recently reported a Ready status for the first time.
For example, Instance A reported its first Ready status at 9:00 AM today. Instance B reported its first Ready status at 8:00 AM today, moved to a Degraded status, then reported a Ready status again at 10:00 AM today. In this case, the Vendor Portal displays the time to install metrics for Instance A, which reported its first Ready status most recently.
For more information about how to interpret the time to install metrics, see Time to Install in Instance Details.
Download Portal
From the Download portal section, you can:
- Copy the URL of the download portal for the customer.
- Generate a new password for the download portal. The customer uses this password to log in.
- Access the unique download portal for the customer.
You can use the download portal to give your customers access to the files they need to install your application, such as their license file or air gap bundles. For more information, see Sharing Assets through the Download Portal.
Instances
The Instances section displays details about the active application instances associated with the customer.
You can click any of the rows in the Instances section to open the Instance details page. The Instance details page displays additional event data and computed metrics to help you understand the performance and status of each active application instance. For more information, see Instance Details.
The following shows an example of a row for an active instance in the Instances section:
 View a larger version of this image
The Instances section displays the following details about each active instance:
- The first seven characters of the instance ID.
- The status of the instance. Possible statuses are Missing, Unavailable, Degraded, Ready, and Updating. For more information, see Enabling and Understanding Application Status.
- The application version.
- Details about the cluster where the instance is installed, including:
- The Kubernetes distribution for the cluster, if applicable.
- The Kubernetes version running in the cluster.
- Whether the instance is installed in a Replicated kURL cluster.
- (kURL Clusters Only) The number of nodes ready in the cluster.
- (KOTS Only) The KOTS version running in the cluster.
- (Replicated SDK Only) The Replicated SDK version running in the cluster.
- The cloud provider and region, if applicable.
- Instance uptime data, including:
- The timestamp of the last recorded check-in for the instance. For more information about what triggers an instance check-in, see How the Vendor Portal Collects Instance Data in About Instance and Event Data.
- An uptime graph of the previous two weeks. For more information about how the Vendor Portal determines uptime, see Instance Uptime in Instance Details.
- The uptime ratio in the previous two weeks.